I remember spending nearly 42 hours during my first month as a junior analyst simply fixing broken date formats and removing duplicate entries in a massive retail dataset. That experience taught me that data analytics is not just about fancy charts; it is about the rigorous process of data wrangling and maintaining data integrity. Many beginners jump straight into complex modeling without realizing that 80% of an analyst's workload involves the ETL process—Extract, Transform, and Load. In this guide, I will share my perspective on how to master Excel for professional-grade analytics, focusing on the transition from manual data entry to automated business intelligence. We will look at how to handle missing value imputation, implement data governance, and eventually build a dashboard design that actually influences decision-making. While many suggest moving straight to Python or SQL, I firmly believe that a deep understanding of spreadsheet automation and logical functions provides a necessary foundation for any serious career in data.
The Core of Data Entry and Validation
Data entry requires strict structural rules to prevent the "garbage in, garbage out" phenomenon that ruins most analytical models. By using tools like Data Validation and Text-to-Columns, analysts can ensure that data enters the system in a standardized, clean format from the start.
In a professional setting, you cannot rely on users to type data correctly. I once managed a project where "New York" was entered in 14 different ways, including typos like "Ney York." This is where Data Validation becomes critical. You should set up dropdown lists and numerical constraints to enforce consistency. If you are dealing with legacy data that is clumped together, the Text-to-Columns feature is your first line of defense for data normalization. It allows you to split strings—like a full name into first and last names—based on delimiters like commas or spaces.
Ensuring Data Integrity Through Deduplication
Data integrity is maintained by identifying and removing redundant records that skew statistical results. Deduplication is the process of scanning your dataset for identical entries and ensuring each observation is unique.
When I work with customer databases, duplicates are my biggest enemy. If a customer is listed twice, your average spend calculation will be wrong. Using the built-in Remove Duplicates tool is a start, but advanced analysts use Logical Functions to flag potential matches that are not exact. For example, a simple formula comparing email addresses can often catch duplicates that names might miss. This step is the bedrock of what we call Data Governance—the practice of managing data as a valuable corporate asset.
Advanced Data Cleaning and Wrangling Techniques
Modern data cleaning in Excel centers on Power Query to handle the ETL process efficiently. This tool allows analysts to create a repeatable sequence of steps to transform messy raw data into a structured format without manual intervention.
If you are still cleaning data by hand every Monday morning, you are wasting time. Power Query is the most significant addition to Excel in the last decade. It allows you to perform complex data wrangling—such as unpivoting columns, filtering rows, and merging different tables—all while recording your steps. If the source file changes, you simply click "Refresh." During my time teaching non-technical teams, I found that mastering Power Query reduced their weekly reporting time from 6 hours to about 12 minutes.
| Cleaning Task | Standard Excel Method | Power Query Advantage |
|---|
| Removing Whitespace | TRIM function | One-click "Trim" for entire columns |
| Combining Files | Copy and Paste | Automatic folder append feature |
| Data Typing | Manual formatting | Automatic schema detection |
| Missing Value Imputation | IFERROR and manual fill | "Fill Down" or conditional replacement |
Handling Outliers and Missing Values
Outlier detection and missing value imputation are essential for preventing skewed results in descriptive statistics. Analysts must decide whether to remove incomplete records or fill them with statistical averages like the mean or median.
In a recent retail analysis, I found a transaction for $99,999 in a dataset where the average was $45. This was a clear outlier, likely a testing error. Using Conditional Formatting to highlight values outside of three standard deviations is a quick way to spot these anomalies. For missing values, you can use the "Fill" feature in Power Query or complex logical functions to replace nulls with a calculated average, ensuring your regression analysis remains robust.
Analytical Frameworks and Business Intelligence
Business intelligence in Excel is powered by Pivot Tables and Power Pivot, which allow for the analysis of millions of rows of data. These tools enable exploratory data analysis by summarizing complex datasets into interactive reports.
Once your data is clean, the real work begins. Exploratory Data Analysis (EDA) involves looking for patterns, trends, and correlations. Pivot Tables are the fastest way to slice and dice data. If you need to go further, Power Pivot allows you to create a Data Model, which is essentially a mini-database inside Excel. This is where you can use DAX (Data Analysis Expressions) to perform advanced calculations that standard formulas cannot handle.
"The goal is to turn data into information, and information into insight." — This philosophy drives the need for Descriptive Statistics in every report I produce.
The Power of XLOOKUP and Logical Functions
XLOOKUP and advanced logical functions serve as the primary methods for merging data across different tables. These functions are more resilient than the older VLOOKUP, as they do not break when columns are added or removed.
I transitioned all my reporting templates to XLOOKUP as soon as it was released. It is faster and handles errors more gracefully. When combined with nested IF or SWITCH functions, you can create complex logic that categorizes data automatically. For instance, you can categorize customers into "Gold," "Silver," or "Bronze" tiers based on their spending habits dynamically. This is a vital skill for anyone moving toward SQL for Excel Users, as the logic is very similar to CASE statements in SQL.
Automating the Analytical Workflow

Spreadsheet automation is achieved through a combination of Power Query and VBA Macros to handle repetitive tasks. This ensures that the analyst spends more time on interpretation and less on data manipulation.
While Power Query handles data transformation, VBA Macros are still useful for automating the Excel interface itself—such as generating 50 individual PDF reports from a master list with one click. However, I usually advise my students to learn Power Query first, as it is more stable and requires less coding. A balanced workflow uses Power Query for the data and VBA for the final output formatting.
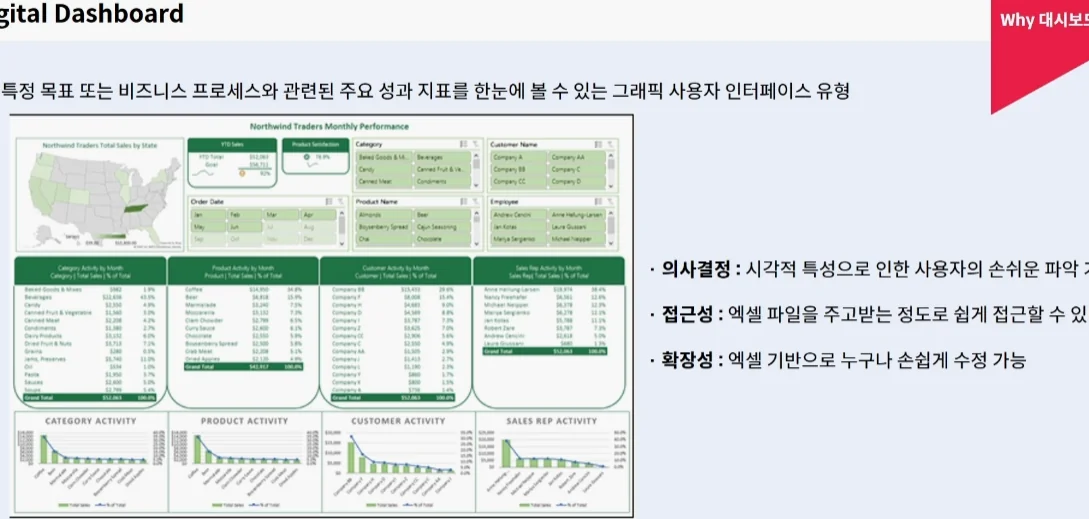
Building Visual Dashboards
Dashboard design is the final stage of the analytical process, where data visualization is used to communicate findings to stakeholders. A good dashboard should be interactive, using slicers and timelines to allow users to filter data themselves.
When I design a dashboard, I follow the 5-second rule: a manager should understand the primary KPI within five seconds of looking at the screen. I use Conditional Formatting sparingly to highlight urgent issues, such as declining sales. The key is not to clutter the screen. Use Pivot Charts that link back to your Power Pivot model for a seamless, professional experience. This is the pinnacle of Data Visualization within the spreadsheet environment.
Frequently Asked Questions
Q: What are the prerequisites for learning advanced Excel analytics? A: You should have a basic understanding of cell references and simple formulas like SUM and AVERAGE. Experience with data entry is helpful but not required as the course covers the ETL process from scratch. Q: Can Excel handle big data like SQL or Python? A: Standard Excel is limited to 1,048,576 rows, which can be a downside for massive datasets. However, using Power Pivot and the Data Model allows you to work with millions of rows by compressing the data efficiently. Q: What kind of portfolio projects can I build with these skills? A: You can build a dynamic sales dashboard, a multi-source financial consolidator, or an automated inventory management system. These projects demonstrate your ability to handle data wrangling and business intelligence.
Frequently Asked Questions
How do I study the basics of Excel data analysis?
It is best to start by learning the data cleaning and refining process. It is most efficient to first learn how to secure data integrity using Power Query and Data Validation, and then move on to the full-scale data analysis (EDA) stage through XLOOKUP or pivot tables.
Why do you recommend Master in Data Entry, Data Cleaning & Data Analysis in Excel?
This is because it covers the ETL (Extract, Transform, Load) process, which accounts for 80% of the work. It is very popular among current employees because it allows them to acquire essential capabilities for refining and processing data for business intelligence implementation in a short period of time, rather than simply creating charts.
Excel data analysis vs SQL, which is better for work?
Excel is faster and more intuitive for small-scale data analysis and visualization, but SQL is advantageous for handling large-capacity DBs. In practice, Excel's Power Query and SQL are often used in conjunction, so we recommend first understanding the data structure with Excel and then expanding to SQL.
How long does it take to develop data cleaning and analysis skills?
If you have basic Excel skills, you can apply it to your work with about 4 to 8 weeks of intensive learning. You can dramatically reduce work hours by mastering data cleaning techniques such as duplicate removal and missing value processing, and then mastering complex pivot tables and data visualization report creation step by step.
What are the disadvantages of Master in Data Entry, Data Cleaning & Data Analysis in Excel?
Due to the nature of Excel tools, speed may be slow when processing ultra-large big data of more than millions of rows. If you aim to become an advanced data analyst, you should supplement your technical limitations by learning professional tools such as SQL or Python in parallel after mastering Excel.
Sources
- Master in Data Entry, Data Cleaning & Data Analysis in Excel - Udemy
