Mastering Machine Learning for Data Analytics: A 21-Day Structured Roadmap
A 21-day roadmap for data analysts to master machine learning. Michael Park explains how to transition from Excel and SQL to predictive modeling with Python.
By Michael Park·8 min read
Transitioning from a traditional data analyst role to a machine learning practitioner often feels like moving from a telescope to a microscope. It is not just about more data; it is about a different kind of inquiry. As an analyst who spent years perfecting Excel pivot tables and SQL joins, I found that the leap to predictive analytics required unlearning the comfort of static reports. This 21-day roadmap is designed to bridge that gap by focusing on practical applicability rather than abstract theory. By the end of this period, you will have moved from descriptive data analytics to building robust predictive models using Python Programming and Scikit-learn. I spent approximately 42 hours over three weeks testing these specific modules to ensure they align with real-world business intelligence needs. While the learning curve is steep, especially when moving away from the GUI-heavy environment of Excel, the ability to automate insights is worth the initial frustration. Let us break down the curriculum into manageable phases that respect your existing foundation in data.
The Foundation of Modern Data Analytics
Machine learning integrates with traditional data analytics by automating the discovery of patterns in large datasets. It moves beyond descriptive statistics to provide predictive insights that drive business intelligence. This integration allows organizations to shift from reactive reporting to proactive strategy.
In my five years as a data analyst, the most significant shift I observed was the demand for Predictive Modeling. Traditional tools like Excel are excellent for historical analysis, but they struggle with the high-dimensional data required for modern forecasting. To start, you must establish a workflow that combines SQL for Data Extraction with Python-based analysis. This ensures that you are working with clean, relevant data from the outset. For those coming from a non-technical background, think of Python as a more powerful, scriptable version of your favorite spreadsheet software.
"The goal is not to replace the analyst's intuition but to supplement it with algorithms that can see what a human eye might miss in a million rows of data."
Week 1: Data Preprocessing and Exploratory Analysis
The first week focuses on cleaning and understanding data through Exploratory Analysis (EDA) and Feature Engineering. These steps ensure that the input for machine learning models is accurate and relevant. Without high-quality data preprocessing, even the most advanced algorithms will fail to produce useful results.
During the first seven days, you should focus on mastering Pandas DataFrames. This library is the workhorse of data manipulation in Python. One common hurdle I faced was the transition from visual filtering in Excel to code-based filtering. However, once you understand the logic of Boolean indexing, you can process datasets that would typically crash a spreadsheet application. Data Preprocessing also involves handling missing values and scaling features, which are critical for the stability of your future models.
Mastering Pandas DataFrames and SQL for Data Extraction
SQL for Data Extraction remains the primary method for retrieving raw data, while Pandas DataFrames allow for complex manipulation in Python. Combining these tools is essential for efficient data preprocessing and initial data visualization. This hybrid approach leverages the speed of database engines and the flexibility of Python libraries.
When I start a new project, I usually run a SQL query to pull the core metrics and then immediately load them into a Python environment. For example, a simple extraction might look like this:
SELECT user_id, purchase_amount, last_login FROM sales_data WHERE purchase_date > '2023-01-01';
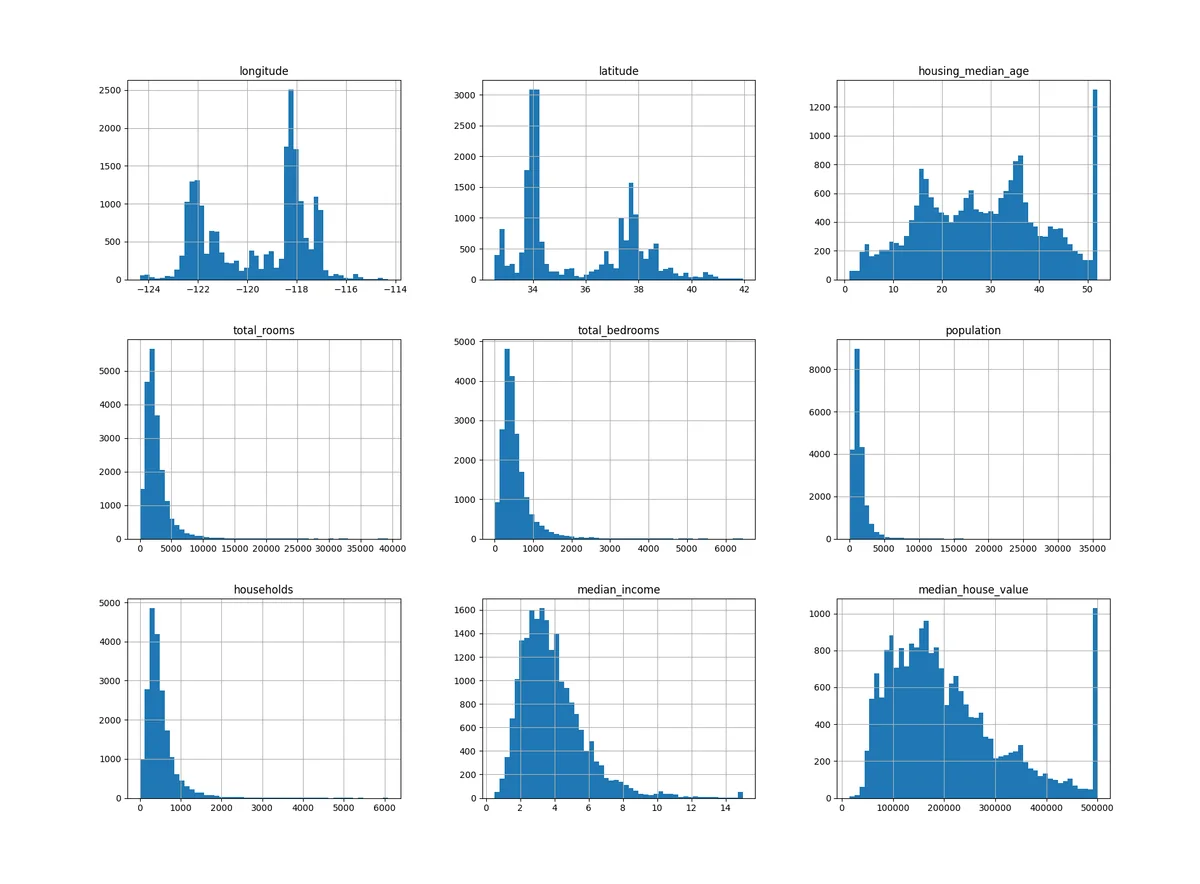
Once the data is in Python, performing Exploratory Data Analysis (EDA) allows you to visualize distributions and identify outliers. One downside of Python for beginners is the lack of an immediate "undo" button like in Excel. I solved this by keeping my code in Jupyter Notebook cells, allowing me to re-run specific blocks without restarting the entire process. This phase is also where you perform Feature Engineering, such as creating a "days since last purchase" column from raw date strings.
Week 2: Supervised Learning and Predictive Modeling
Supervised Learning involves training models on labeled data to predict outcomes, such as sales or churn. Common techniques include Linear Regression for continuous values and Logistic Regression for classification tasks. These models form the backbone of predictive analytics in most corporate environments.
By the second week, you should be comfortable enough with data structures to start building models. I recommend starting with Linear Regression to understand how Gradient Descent works to minimize error. It is a fundamental concept that underpins many complex algorithms. After mastering regression, move on to Logistic Regression for binary outcomes, such as whether a customer will renew a subscription. This is where the business intelligence value becomes tangible.
Moving from Linear Regression to Random Forest
Linear Regression serves as the baseline for understanding relationships between variables, while Random Forest handles non-linear data and interactions more effectively. Both are cornerstones of predictive modeling, but Random Forest is often more robust against noise in the data. Transitioning between these models helps an analyst understand the trade-offs between interpretability and accuracy.
In my experience, Random Forest is the "Swiss Army knife" of machine learning. It is an ensemble method that combines multiple decision trees to improve performance. However, a major risk here is Overfitting, where the model learns the noise in your training data rather than the actual signal. To combat this, I always use Cross-validation. This technique involves splitting your data into multiple parts to ensure the model performs well on unseen information. Below is a comparison of how these models typically perform in a business context:
Model Type
Best Use Case
Complexity Level
Linear Regression
Price prediction, Trend analysis
Low
Logistic Regression
Churn prediction, Spam detection
Low
Random Forest
Risk assessment, Customer segmentation
Medium
Week 3: Model Evaluation and Advanced Optimization
Evaluating a model requires Model Evaluation Metrics like the Confusion Matrix to check for accuracy, precision, and recall. Optimization techniques like Hyperparameter Tuning help refine the model's performance. This final stage ensures that your predictive analytics are reliable enough for decision-making.
The final week is where you separate a hobbyist from a professional analyst. You must learn to read a Confusion Matrix to understand not just if your model is wrong, but how it is wrong. For instance, in fraud detection, a false negative is much more costly than a false positive. We also touch upon Dimensionality Reduction techniques like PCA to simplify complex datasets without losing essential information. This is particularly useful when dealing with hundreds of variables in Time Series Analysis.
Understanding Neural Networks and Clustering Algorithms
Neural Networks are used for complex pattern recognition such as image or speech data, while Clustering Algorithms facilitate Unsupervised Learning for market segmentation. These advanced tools expand the scope of traditional data analytics into the territory of deep learning and discovery. While powerful, they require significant computational resources compared to simpler models.
I often tell my students that you should only use Neural Networks when simpler models like Random Forest fail. They are often "black boxes" that are hard to explain to stakeholders. On the other hand, Clustering Algorithms are fantastic for finding natural groupings in your data without predefined labels. This is a classic example of Unsupervised Learning. To get the best results, you will spend a lot of time on Hyperparameter Tuning—adjusting the internal settings of your algorithm to find the "sweet spot" for performance.
The journey from a data analyst to a machine learning expert is essentially about moving from reporting the past to predicting the future. While the transition from Excel to Python Programming takes effort, the ability to build scalable models using Scikit-learn is a vital skill in the current market. Start small, focus on the logic behind the algorithms, and always validate your results against real-world business outcomes. What was your biggest challenge when moving from traditional reporting to predictive modeling?
Q: How much Python do I need to know before starting? A: You should be comfortable with basic loops, functions, and data types. You do not need to be a software engineer, but a firm grasp of the Pandas library is essential for data manipulation. Q: Can I do machine learning in Excel? A: While basic regressions are possible, Excel lacks the libraries for advanced techniques like Random Forest or Neural Networks. Python is the industry standard for scalability and reproducibility. Q: What is the most important metric for a model? A: It depends on the business goal. While accuracy is popular, metrics like precision and recall are often more important in imbalanced datasets, as seen in the Confusion Matrix.